Indicator for ozone damage to vegetation through construction of an ozone flux model
Increased ozone concentrations can lead to leaf discolouration and defoliation, stunted growth or even premature death of the plant. For crops this moreover leads to reduction in yield. The ozone flux model calculates PODY values for potatoes, grassland, corn, wheat, arable land, hardwood and softwood in Flanders or Belgium.
Ozone flux versus ozone concentration as indicator for ozone damage to vegetation
The new study report builds upon the recommendations of the MIRA literature and feasibility study conducted in 2013 by Deutsch and Vandermeiren (2013). In this study, the added value of calculations of ozone damage to vegetation based on the ozone flux was illustrated in comparison with the 'classical' indicator based on ozone concentrations in the air (AOT40ppb). In fact, only part of the ozone in the ambient air effectively enters the plant via the stomata. It is this ozone absorption that determines the damage to the plant. The plant controls the degree of opening of the stomata to adjust transpiration and photosynthesis processes to the ambient conditions. The effective ozone absorption is therefore determined by both the ozone concentration in the ambient air, a number of ambient factors (temperature, air and soil moisture, light intensity, etc.) as well as specific plant characteristics (number of stomata, stage of development of the plant, etc.).
The prior feasibility study had shown that the information from the existing models - CHIMERE (notably the meteo-preprocessor with ECMWF data) and RIO - and the version of the DO3SE module which is implemented in the EMEP European air quality model, provides the building blocks for constructing a Flemish ozone flux model.
Calculation of the ozone flux based on the ozone flux model
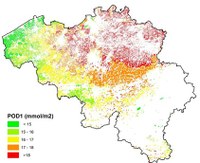
In this study, we developed the 'O3flux' program which allows for the area-wide calculation of the Phytotoxic Ozone Dose, PODY (expressed in mmol ozone per m2 leaf surface area).
The ozone flux program allows PODY values to be calculated at field level for potatoes, arable land, grassland, corn, wheat, hardwood and softwood in Flanders or Belgium. In the study, calculations were made for the year 2009 and the results presented in the form of maps. By way of illustration, the figure below shows the PODY map for arable land.
We investigated the effect of the parameter 'soil moisture' on the results and of the choice of input for the photosynthetic active radiation. The code for the developed ozone flux model is based on the DO3SE module from the European air quality model, EMEP. For verification purposes, the results were compared with those of the EMEP model. For the implementation, the EMEP code was left unchanged wherever possible in order to reproduce the EMEP results as accurately as possible and to allow future changes to the EMEP code to be incorporated as easily as possible.
For potatoes and wheat, existing dose-response functions were used to estimate the loss of crop yield on the basis of the calculated PODY values. In 2009, potato yield in Flanders fell on average by 4.7 % as a result of ozone exposure; the yield loss for wheat was on average 10 %.
Upgraded ozone indicators based on the ozone flux
The developed ozone flux model will be used this year to develop new MIRA indicators. These will then be used to annually monitor the development over time and the distribution of the impact of increased ozone concentrations on different vegetation species in Flanders.
- Read the full report: Development of an indicator for ozone damage to vegetation in Flanders through construction of an ozone flux model (Dutch report with English summary)
- Further background information: Ozone damage to vegetation: Literature study and study into the feasibility of an ozone flux-based indicator and into the implications for the area-wide calculation via an air quality model (Dutch report with English summary).


