The Index for Sustainable Economic Welfare (ISEW) for Flanders 1990-2013
Sustainable economic welfare
The Index for Sustainable Economic Welfare (ISEW) was developed in response to the criticism against the gross domestic product (GDP) being used as welfare indicator. Because the ISEW examines the benefits (e.g. extra consumption) and the costs (e.g. environmental pollution) of economic activities, this index provides a more accurate picture of economic welfare than does the GDP (which considers only the size of economic activities).
The ISEW shows how an economy contributes to the well-being of the population. This is done by weighing the benefits and the costs of economic activities. The benefits are reflected in the expenditures of households. However, in contrast to the GDP, the ISEW takes into account not only these benefits but also factors such as the value of (unpaid) household work, the welfare losses from income inequality and the welfare-enhancing public expenditures (e.g. for education and health care). The costs of economic activities in the ISEW relate to the loss of ecosystem services, both by the degradation of our living environment (water, air, climate and ozone depletion) and by the depletion of our natural capital (e.g. biodiversity). All components within the ISEW are expressed in monetary terms, so that it can be compared directly with the GDP.
The ISEW provides a wide range of data and insights for policy makers, for example, on the wider effects of current policy on the environment (e.g. water and air pollution) or on social aspects (e.g. income distribution, time allocation). As such, this index contributes to a more effective policy that is aimed at sustainably enhancing the economic dimension of well-being.
Evolution of economic welfare in Flanders
If we compare and analyse the evolution of ISEW and GDP, we see that they may evolve in different, and in some cases even opposite, ways.
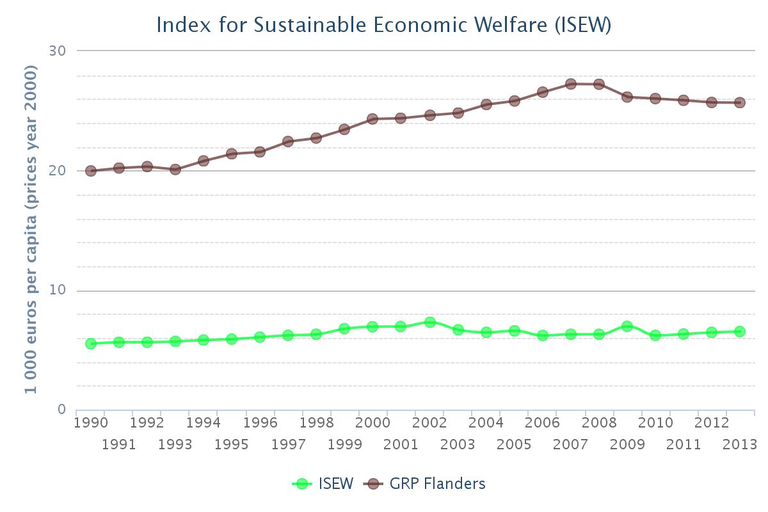
Between 1990 and 2013, GDP per capita in Flanders grew by 28.6 %. Over the same period, ISEW per capita for Flanders increased less rapidly, namely by 19.9 % (see figure).
GDP per capita increased until 2008 and decreased by 5.3 % over the period 2009-2013, as a result of the financial-economic crisis. A period of increase in ISEW between 1990 and 2002 was followed by a sharp decline between 2002 and 2008 (15 % in total, or 2.1 % on an annual basis). In 2009, ISEW per capita showed a marked increase (+10.5 % compared to 2008), whereas GDP per capita for Flanders decreased (-3.9 %). In 2010, ISEW per capita declined again (-10.9 %). In 2011 and 2012, ISEW per capita stabilised and GDP per capita continued to decline, with a slight increase being observed again in 2013 (+1.9 %).
The sharp decline in ISEW between 2002 and 2008 was caused by an increase in income inequality in Flanders. The increase in long-term environmental costs also contributed to the decline in ISEW per capita for Flanders, albeit to a lesser degree. In 2009, ISEW per capita increased strongly, mainly as a result of the decrease in costs of our economic activities. The economic crisis was responsible for the decline in use of non-renewable energy sources. In 2010, an opposite evolution was observed, with ISEW per capita falling sharply due to the increase in the use of non-renewable resources.
After two stable years, 2011 and 2012, the shift in the evolution of income inequality in 2013 led to a decrease in welfare losses due to income inequality. This compensated for the increased costs for energy use and greenhouse gas emissions.
Insights for a more effective policy
A policy focusing on maintaining and improving environmental quality can positively impact the ISEW despite its short-term negative effect on household expenditures. A decline, for example, in greenhouse gas emissions and more efficient use of non-renewable natural resources will be reflected in a decrease in the costs of air pollution or climate change and a lower total replacement cost for the use of non-renewable energy sources. The lower costs can compensate for a possible temporary decrease in household expenditures. By considering both costs and benefits of policy measures, the ISEW approaches policy analysis from a different perspective than does the GDP. If looking only at the GDP, such policy measures will be assessed negatively due to the decrease in total consumption.
However, a number of barriers remain to be overcome in stimulating policy to make greater use of alternative welfare indexes such as ISEW:
- Political and contextual barriers: e.g. lack of democratic legitimacy for this type of indicators;
- Barriers linked to the indicators themselves: e.g. need for improved valuation methods for specific indicator components;
- Structural, process- or use-related barriers: e.g. no clear procedure for pursuing an integrated, innovative economic policy, and a non-responsive administrative and institutional culture within the user group.


